Wednesday, August 19, 2015

AEROSOLS : What Do They Have to Do With The Indian Heat Wave 2015? - PART 2


“Jet streams and Jet meandering can be linked to extreme events like heat waves”, remarked one of the seminar speakers at Atmo. It struck me, “What could be the causes of the extreme heat wave in India in summer 2015? Is there a link between  jet stream patterns n stuffs n heat waves?”, raced my mind…But, no really, I’m not an expert in general circulation or dynamics. I work on Air pollution. I was wondering, what the current data from satellites can tell me about Indian heat wave and its link to Aerosols. Ah , I hear you, if you had read my previous post, you should go, ‘Duh! Aerosols, do have an impact on local weather’.

I started delving into the details… (in my advisor’s terminology, ‘extracting science from the vast varieties of ugly data’). 


The major heat wave struck the southern India in the latter half of May 2015. You can see the impact of heat wave from the outgoing IR radiation picture below (More the emitted IR radiation, hotter the place). I picked a small region (red boxed) in the southern India near Andhra pradesh.

Outgoing longwave radiation from TERRA satellite(NASA Earth observatory : http://earthobservatory.nasa.gov/IOTD/view.php?id=85986)

Red boxed region in the Image is the study area in India. This is in the state called 'Andhra Pradesh'. I made some quick analyses of this event and how aerosols can be linked to heat wave below: 

Some initial interesting results :
1. NCEP NCAR reanalysis (Ok, to put it simpler, these are gridded data that combine information from weather models and ground/satellite observations and produce pretty maps J) maps near Andhra Pradesh show cooler anomalies every two years. Here is a snapshot of May month average anomaly maps from 2010 – 2015. The anomalies in the intermittent years are really high and 2015 is one of them.
2010 NCEP NCAR surface temperature anomaly for May 
2011 May anomaly 


2012 May anomaly 

2013 May anomaly

2014 May anomaly 

2015 May anomaly 


2. When the sensor AIRS on board Aqua satellite flew over India, it watched the heat wave temperatures. Here, we are looking at the time averaged surface temperature for the month of May in 2010, 2011, 2012, 2013, 2014, 2015. The biennial pattern (“HOT YEAR-HOT YEAR-COLD YEAR; HOT-HOT-COLD”) shown by NCEP NCAR reanalysis data is also reflected in in the regions extending between 16N-18N and 77E – 84E. Look at the red boxed region shown in the first image. 

2010 May mean surface temperature 

2011 May surf_temp

2012 May surf_temp

2013 May surf_temp

2014 May surf_temp

2015 May surf_temp
3. Zooming in on 2015 and comparing it against one of the relatively cold summer, 2011 (I mean, less warmer….ooosh, it’s tropics!), we can see that the latter half of May 2015 was much hotter and 13 days showed temperatures more than 500C. The mean of May 15-30 , 2015 is higher than 2011.


2011 May, Timeseries of daytime surface temperature from AIRS sensor  for the boxed region

2015 May (heat wave year), Timeseries of daytime surface temperature from AIRS sensor for the boxed region
 4. Let’s see how this is linked to aerosols or suspended particles in the atmosphere. In this context, satellites look down on Earth and see how much turbid the atmosphere is or how thick is the layer of aerosols in the atmospheric column extending from surface (caveat!) until the top of the atmosphere. Here, I show aerosol loadings seen from a UV sensor (OMI) onboard the Aqua. The spatial maps of UV aerosol index (representing mostly dust and smoke) are shown below for May 2010, 2011, 2012, 2013, 2014, and 2015 (once again, focus on the boxed region that was pointed above in the initial figure in red). 


If you look closer on the monthly average aerosol loading for May from OMI, starting from 2010 until 2015, voila! Does the pattern seem familiar? We see the distinct biennial pattern here as well! (High aerosol loading – high aerosol loading – cold. 2010 is high, 2011 cold, 2012, 2013, high, 2014, cold, 2015 is high).

To me, it looks like a promising link - Biennial patterns in increase in surface temperature patterns (hot hot cold) and aerosol loadings (high loading, high, low). What are the probable aerosols that could impact the intensity of heat waves, if the results here, hold good? See you in my next blog..

Thanks for reading! 


Wednesday, August 5, 2015

AEROSOLS : What Do They Have to Do With The Indian Heat Wave 2015?

That was a tense Indian summer which intense heat waves smashing the country. What makes it “record breaking”?
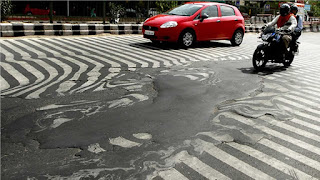
Delhi roads melting due to intense heat waves (abc7news.com)
See this? Petrified? So was I…The intense episode of 2015 Indian heat wave hit the list of top 5 deadliest heat waves! This is not new though. So, you ask, why are we talking about this now if this has been a tradition in India, every summer?
Guess what?? “Recent increase in the frequency, persistency, and spatial coverage of heat waves when compared to 1970s”, quote a few articles. This could be a close resemblance to more intense heat waves in future.

In general, heat waves are affected by numerous factors ranging from large scale meteorological patterns and local aerosol effects. What intrigued me was the effect of aerosols on these heat waves in Indian megacities like Delhi and Hyderabad.

You ask, who cares about the small particles that exist less than a week?…Now, walk outside, lift your eyes, watch the beautiful sky if you are lucky… most likely , if you are like most of us, living in megacities, you might be looking out on veil of smoggy particles or coarse dust and pollen.. And that’s what I’m talking about – AEROSOLS ! 
Aerosol sources (Image courtesy : caice.ucsd.edu)
That got me thinking about some specific questions and hypothetical reasoning regarding the heat waves in Delhi and Hyderabad.

a) ‘How local effects of pollutants, especially, aerosols (e.g. dust, black carbon particles) alter the intensity of heat waves?
Hypothesis: Well, this is a familiar one. Aerosols like Black Carbon (BC : in simple terms, the smoke you see in a burning candle and the black smoke you see out of a vehicle hold BC particles.) absorb radiation from the atmosphere and re-emit that radiation and transfer the heat back to the atmosphere. This can act like a SELF AMPLIFYING EFFECT to the heat waves, therefore increasing their intensities.

b) Now, let’s take a step back and turn the question around. Imagine this sweltering heat and lower wind speeds which is usually the case during heat waves, what happens to aerosols in that region? They accumulate due to lower wind speeds. If they are absorbing aerosols like BC, they have a feedback to the heat waves, THUS CAUSING THE SELF AMPLIFYING EFFECT.  
Delhi, being a megacity, the effects of increased urbanization can cause wind stagnation and low horizontal transport of pollutants.

C) What is the probability of a year experiencing a heat wave in the study area given the local effects of aerosols?
If we consider this aerosol heat wave feedback into the system, will the heat wave intensity significantly increase in future years, if we increase the load of aerosols?

Well, in terms of global warming, these are much familiar questions. We know human induced pollution has a huge impact on surface temperature changes across the globe. But, what appears as a tangential question is, “how do these short lived pollutants affect the intensity of episodic heat waves that last only for a couple of weeks?”

I’ll let you guess the details until a later post how these hypotheses can be tied to the Indian heat wave case study in Delhi.


I was bullied and harassed on Facebook.

Online harassment and gas lighting are fearful experiences that many of us struggle to speak in public. I recently got verbally abused, thre...